 Ultimate guide
What Soil Microbial Testing Reveals About Your Soil
Last Updated: November 5, 2026
Quick Summary
Soil microbial testing reveals the living fraction of your soil, the bacteria, fungi, protozoa, and other organisms that drive decomposition, nutrient cycling, and plant health. It quantifies the abundance, activity, and composition of microorganisms, showing whether the biological engine that converts organic matter into plant-available nutrients is intact and balanced.
- A standard chemistry panel shows what nutrients are present but not whether biology can deliver them.
- Microbial biomass carbon is the single best broad indicator of biological capital.
- Respiration measures how fast the community works, with very low readings signaling dormancy.
- The fungal-to-bacterial ratio shows whether your soil supports a disturbed or stable system.
- Read results against your own field history, not universal thresholds, and re-test on the same schedule.
Table of Contents
- What Soil Microbial Testing Measures Beyond Chemistry
- The Living Fraction a Standard Test Misses
- Microbial Biomass and Abundance
- Soil Microbial Activity: Respiration, Decomposition, and Carbon Cycling
- Bacterial and Fungal Communities and the Fungal-to-Bacterial Ratio
- Soil Test for Fungus: What Fungal Biomass Tells You About Your Fields
- Soil Pathogen Testing and the Beneficial-to-Harmful Balance
- Soil Microbial Testing Methods: PLFA, Dilution Plating, and Molecular Analysis
- Microbial Diversity, Community Composition, and Nutrient Cycling
- How to Read Test Results and Reference Ranges
- Sampling Design, Handling, and Repeatability
- Limitations of Microbial Tests and What They Cannot Prove
- Frequently Asked Questions
What Soil Microbial Testing Measures Beyond Chemistry
Soil microbial testing reveals the living fraction of your soil: the bacteria, fungi, protozoa, and other organisms that drive decomposition, nutrient cycling, and plant health.
That distinction matters.
Below, we break down what each measurement means, how to read your results, and where testing's limits sit.
What soil microbial testing measures: Soil microbial testing quantifies the abundance, activity, and composition of microorganisms in a soil sample.
The Living Fraction a Standard Test Misses
A routine soil test reports pH, phosphorus, potassium, calcium, and organic matter. Those numbers describe the pantry, not the cooks.
The living fraction includes bacteria, fungi, protozoa, nematodes, and the enzymes they release. These organisms mineralize nitrogen, solubilize phosphorus, and build soil aggregates. When that community collapses, applied nutrients sit unavailable and fertilizer efficiency drops.
Microbial biomass is the total mass of living microorganisms in the sample, usually reported as micrograms of carbon per gram of dry soil. It is the single best broad indicator of biological capital.
Microbial Biomass and Abundance
Biomass measurement answers a simple question: how much life is in this soil?
Abundance alone does not prove function. A soil can carry high biomass and still cycle nutrients poorly if composition is skewed toward one group, which is why we read biomass alongside activity and ratio data.
A common mistake is chasing high biomass with heavy compost while ignoring the fungal component. Biomass rises, but the community stays bacterial-dominant and the structural benefits never materialize.
Soil Microbial Activity: Respiration, Decomposition, and Carbon Cycling
Soil microbial activity measures how fast the community is working, typically through soil respiration, the carbon dioxide released as microbes break down organic matter. High respiration signals an active, feeding community. Very low respiration signals dormancy.
Respiration connects directly to carbon cycling: microbes consume organic matter, respire carbon, and release nutrients in plant-available forms.
Watch the extremes. Extremely high respiration can indicate a flush of easily decomposed material rather than stable function, and it may signal nitrogen tie-up if carbon inputs are too wide.
Bacterial and Fungal Communities and the Fungal-to-Bacterial Ratio
The fungal-to-bacterial ratio describes the balance between two broad microbial groups and is one of the most useful indicators a microbial test returns. Bacteria dominate disturbed, input-heavy soils. Fungi dominate stable, perennial, low-disturbance systems.
Neither group is "good" or "bad." The ratio tells you what kind of system your soil supports. Annual row crops generally run bacterial-dominant; perennial pastures, orchards, and mature no-till systems trend fungal.
Why the Ratio Shifts With Tillage and Inputs
Tillage shreds fungal hyphae, the long filaments that build soil structure and move nutrients across distances a bacterium cannot travel. Every pass resets the fungal network toward bacterial dominance. Synthetic nitrogen and repeated chemical inputs push the ratio further in the same direction.
Reversing it takes time and a planned transition. If you are weighing how to step down from a conventional program without losing a season, our guide on how to transition a farm away from chemicals step by step walks through the sequence we recommend.
Soil Test for Fungus: What Fungal Biomass Tells You About Your Fields
A soil test for fungus isolates the fungal portion of the community, reported as fungal biomass or as a share of total biomass.
Low fungal biomass is a red flag in perennial systems, orchards, and pastures, where crops depend on fungal partnerships, including mycorrhizal associations, to access nutrients.
For annual systems, a moderate fungal presence still pays off in residue breakdown and aggregate stability. Fungal biomass is not a vanity metric. It predicts how well your soil holds together under rain and traffic.
Soil Pathogen Testing and the Beneficial-to-Harmful Balance
Soil pathogen testing screens for disease-causing organisms such as Pythium, Rhizoctonia, Fusarium, and plant-parasitic nematodes. The result matters most as a balance question, not a presence-or-absence verdict.
Most soils contain some pathogens. Disease pressure emerges when harmful organisms outnumber the beneficial microbes that suppress them through competition, parasitism, and triggered plant defenses.
When a pathogen screen comes back hot, the productive question is what happened to the suppressive biology. Compaction, waterlogging, and repeated fumigation all strip beneficial organisms and open the door for pathogens to dominate.
Soil Microbial Testing Methods: PLFA, Dilution Plating, and Molecular Analysis
Soil microbial testing methods fall into three families: phospholipid fatty acid analysis (PLFA), dilution plating and culturing, and molecular analysis. Each answers a different question, and choosing the wrong method for your question wastes money and produces a report you cannot use.
Start from the decision you need to make, not the lab's menu. A grower asking "is my biology depleted?" needs a different test than one asking "which pathogen is limiting this block?" Treating all microbial tests as interchangeable is the most common and most expensive mistake in this category.
- PLFA measures the fatty acids in cell membranes to estimate biomass and broad community composition, including the fungal-to-bacterial ratio. It reflects the living community at sampling time. It is strong on biomass and ratio data, faster and less expensive than full sequencing, and does not require DNA extraction. It reports broad groups, not species, so it will not tell you which Fusarium or which mycorrhizal genus is present.
- Dilution plating grows organisms on culture media and counts what forms colonies. It captures only the fraction that grows under lab conditions, often a small minority of soil organisms, so it is best treated as an index for specific, culturable targets such as certain pathogens or functional groups, not as a census of the community.
- Molecular analysis extracts DNA to identify organisms by sequence, including species that cannot be cultured. Amplicon sequencing describes community composition in detail; quantitative PCR (qPCR) targets specific organisms or genes and returns abundance for those targets. Molecular methods cast a far wider net than culturing, but they detect DNA, and DNA can persist after an organism is no longer active, detection is not the same as function.
Culture-Based Versus Molecular Approaches
Culture-based methods are inexpensive and useful for specific pathogen screens, but they miss most soil organisms because the majority will not grow on a petri dish. Molecular methods cast a wider net and identify composition in detail, at higher per-sample cost and with more demanding interpretation.
PLFA sits between the two: broader than culturing, faster and less expensive than full sequencing, and strong on biomass and ratio data. If your real goal is cutting input costs, our article on how to reduce fertilizer costs without cutting yield connects biological findings to that budget question.
Choosing a Test by Question, Crop, and Budget
A decision framework beats a menu. Match the test to the question you are actually trying to answer:
- "Is the biological engine depleted or healthy?" Start with microbial biomass carbon plus respiration. This is the lowest-cost combination that shows both standing biological capital and current activity, and it is the right first test for most row-crop and pasture operations.
- "Is my system bacterial- or fungal-dominant, and is it shifting?" Add PLFA for the fungal-to-bacterial ratio. This matters most in orchards, vineyards, pastures, and mature no-till where fungal infrastructure drives structure and nutrient access.
- "Which pathogen is pressuring this block?" Use a targeted pathogen screen, culture-based for culturable organisms, qPCR for specific targets, and read it alongside a beneficial community profile. A pathogen number without the suppressive-biology context is half a picture.
- "Did my management change the community?" Use the same method at the same depth and season on a repeat schedule. Consistency matters more than sophistication; a changing method destroys the comparison.
- "What is the full community composition?" Amplicon sequencing gives the deepest view, but it is the most expensive and the hardest to translate into field decisions. Reserve it for research questions, diagnostic puzzles, or operations with a clear plan for acting on the output.
Budget and turnaround follow the same logic. Costs and turnaround vary by method and lab, so confirm current pricing and timelines directly with the lab or with BioSys for a quote.
Watch out: comparing results from two different methods or labs as if they were the same measurement reliably draws the wrong conclusion. Pick a method and a lab, and hold them constant.
Sample requirements also differ by method. Confirm with the lab how much soil each test needs, whether the sample must be kept cool or frozen, and how quickly it must arrive.
Microbial Diversity, Community Composition, and Nutrient Cycling
Microbial diversity is the variety of organisms in the sample, and community composition is the mix of groups present. Diversity supports resilience: a broad community keeps functioning when conditions stress part of it.
Nutrient cycling depends on that diversity. Different organisms mineralize nitrogen, solubilize phosphorus, and decompose different fractions of organic matter. A narrow community leaves gaps that show up as nutrient deficiencies even when soil tests report adequate levels.
Excess nutrients cause their own problems. If you want the practical next step, read our breakdown of how to improve soil microbial health.
How to Read Test Results and Reference Ranges
Read microbial results against three references: your own field's history, the range your lab reports for your soil type and climate, and the direction of change between tests. No universal target fits every soil, and the reason is structural, not a matter of opinion.
Microbial biomass, respiration, and ratio values shift with soil texture, organic matter, climate, cropping system, and season.
The useful approach is to build your own reference band. Sample the same zones, at the same depth, at the same time of season, and run the same method and lab each time.
Start with biomass and activity together. Low biomass with low respiration points to a depleted system. Adequate biomass with low respiration suggests dormancy from compaction, low organic matter, or recent chemical application.
| Indicator | Low Reading Suggests | High Reading Suggests | First Action |
|---|---|---|---|
| Microbial biomass | Depleted organic matter, chemical stress | Recent heavy compost, active flush | Build organic matter steadily |
| Respiration | Dormancy, compaction, low food | Unstable material, possible N tie-up | Check carbon-to-nitrogen balance |
| Fungal-to-bacterial ratio | Tillage, synthetic input history | Stable perennial system | Reduce disturbance, add fungal foods |
| Diversity | Narrow community, monoculture history | Resilient, varied system | Diversify rotations and inputs |
Why Universal Thresholds Fail Across Soil Types and Methods
A threshold is only meaningful inside the population it was derived from. A biomass target developed on Midwest corn ground does not transfer cleanly to a sandy Coastal Plain field, a high-desert orchard, or a pasture with decades of manure history.
Treat any published range as a starting orientation, not a pass/fail line. Ask the lab what population its range was built from and whether it is method-specific. If the lab cannot answer, use the range only as a rough sanity check and lean on your own trend data.
Turning a Reading Into a Cautious Decision
Interpretation should end in a small, testable management change, not a wholesale program overhaul. A workable sequence:
- Identify the limiting signal. Low biomass and low respiration point toward building organic matter and reducing disturbance. Adequate biomass with low respiration points toward relieving compaction or removing a recent chemical stress. A bacterial-skewed ratio points toward reduced tillage and fungal foods.
- Change one variable at a time. If you alter tillage, cover crop, and amendment program in the same season, you cannot tell which change moved the biology.
- Re-test on the same schedule. Give the change a full season before drawing conclusions, and compare against your own prior readings rather than a universal target.
- Keep the chemistry in view. Microbial results explain why chemistry underperforms; they do not replace a chemistry panel. Read them together.
Watch out: treating a single elevated or depressed reading as proof of a problem is the most common interpretation error. Season, moisture, and crop stage all move these numbers, so a one-time result is a starting point, not a verdict.
For a full walkthrough of turning numbers into decisions, our guide on soil biology test results and how to act on them covers the interpretation step in detail.
Sampling Design, Handling, and Repeatability
Sampling design decides whether your results mean anything. A microbial test is a snapshot measurement, and a careless sample produces a number that reflects handling, not your field.
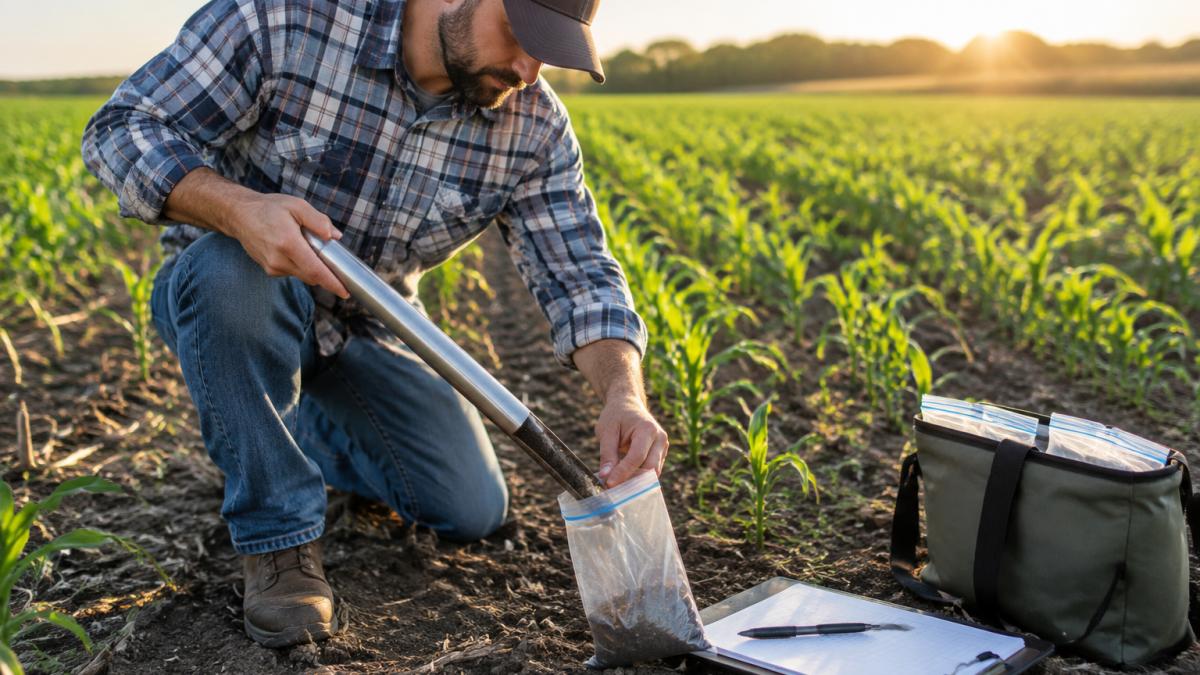
Collect cores from multiple points in a defined zone, mix them into one composite, and keep the sample cool and out of direct sun.
Repeatability comes from consistency. Sample the same depth, the same time of season, and the same zones every time. If you change the method between tests, you cannot tell whether the soil changed or the sampling did.
Limitations of Microbial Tests and What They Cannot Prove
Microbial tests describe a community at a moment in time.
Results vary with season, moisture, and crop stage, and labs differ in methods and reporting, so comparing reports from two different labs is unreliable.
What a test can do is show direction.
Soil biology rarely fits a spreadsheet, which is why testing beats guessing. If your chemistry looks fine but yields and input efficiency have stalled, the missing answer may be biological.
Frequently Asked Questions
What does soil microbial testing measure?
Soil microbial testing measures the living fraction of your soil: microbial biomass (the total mass of bacteria and fungi), microbial activity (respiration and decomposition rates), and community composition (which groups are present and in what proportions). Many labs also report the fungal-to-bacterial ratio and diversity indices. Together these indicators show how well your soil can cycle nutrients, build structure, and suppress pathogens, which a standard NPK test cannot reveal.
How do you test soil for bacteria and fungi?
Labs use several soil microbial testing methods. Phospholipid fatty acid (PLFA) analysis identifies broad groups like gram-positive bacteria, gram-negative bacteria, and fungi by their cell membrane fats. Dilution plating grows live organisms on selective media, while molecular analysis (DNA sequencing) identifies species-level composition. Each method answers a different question, so choose based on whether you need biomass, activity, or community composition.
What is the difference between soil microbial activity and microbial diversity?
Microbial activity measures how fast organisms are working, typically through soil respiration (CO2 release) or decomposition rates. Microbial diversity measures how many different types of organisms are present and how evenly they are distributed. A soil can have high activity but low diversity, for example when a few fast-growing bacteria dominate after tillage. Both matter: activity drives nutrient cycling, while diversity supports resilience and pathogen suppression.
How should you collect a soil sample for microbial testing?
Collect a composite sample from 8 to 12 random spots within a uniform management zone, at a depth of 0 to 6 inches for most field crops. Mix the cores in a clean bucket, then fill a labeled bag and keep it cool (not frozen) until shipping. Avoid sampling right after fertilizer application or within 48 hours of a heavy rain. Consistent depth, timing, and zone boundaries make repeat tests comparable year to year.
Can a soil test identify beneficial and harmful microorganisms?
Soil pathogen testing can detect specific harmful organisms such as Fusarium, Pythium, and Rhizoctonia, while beneficial microbes like mycorrhizal fungi and nitrogen-fixing bacteria can be quantified through PLFA or molecular analysis. Most routine microbial tests report broad groups rather than individual species, so pair a general test with targeted pathogen testing if you suspect a disease problem. Results show presence and abundance, not guaranteed disease outcome.
How often should soil microbial testing be done?
Test at least once a year, ideally at the same time each season, to track trends in biomass, activity, and the fungal-to-bacterial ratio. If you are transitioning to regenerative management, test every 6 to 12 months for the first two years to see how quickly the community responds. Single tests are a snapshot; repeated tests under the same sampling protocol are what reveal whether your management is moving the biology in the right direction.